This web page was produced as an assignment for Genetics 564, an undergraduate capstone course at UW-Madison.
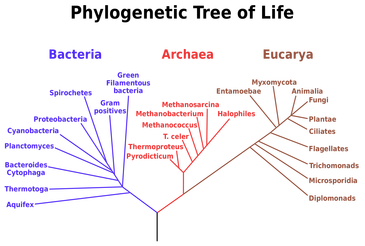
What is protein phylogeny?Phylogenetic analysis is "the study of evolutionary relationships among molecules, phenotypes, and organisms" [1]. Phylogenetics and protein sequence analysis allows us to study the evolutionary history of proteins and the change in their functions. Not only does this analysis provide historical context, but it also provides insight into the construction of gene families, prediction of gene function, gene discovery, and more. Phylogenetic trees are structures derived from mathematical methods that represent the evolutionary history and historical relationships of groups of organisms or genes. There are many methods used to construct phylogenetic trees, all with the end goal of identifying the best estimate for the true evolutionary history of the protein sequence data that is being analyzed [1]. Some of these methods are discussed below.
|
|
Constructing a Phylogenetic Tree
Sequence Alignment
The first step to creating a phylogenetic tree is to obtain the gene or protein sequences from the organisms you wish to compare. Here, ten FASTA formatted p53 homolog protein sequences were compiled using HomoloGene and Ensemble. The FASTA sequences for each protein are linked on the Homology page (compiled sequences can also be found at the bottom of this page). In order to construct a tree, it is necessary to align these sequences using a multiple sequence alignment tool. These sequences were aligned using Clustal Omega. The output can be visualized using JalView, as seen below. Figure 1 represents the entire alignment output; figure 2 is a closer view that represents the color comparisons within the sequences. The differences in colors represents the extent to which the protein sequence is conserved between species. Conservation and quality scores are also provided, as well as a consensus sequence.

Figure 1: Sequence alignment using Clustal Omega

|
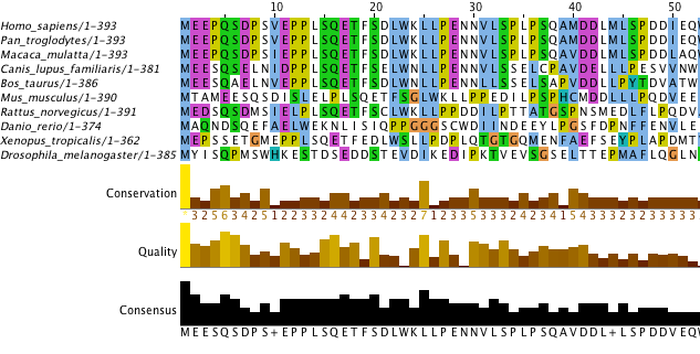
Figure 2: Close-up view of sequence alignment
|
Sequence Similarity Scoring
There are multiple ways that the aligned sequences can be scored based on similarity. This analysis can be used to inform the construction of phylogenetic trees. The two scoring methods used here are BLOSUM and Percent Identity.
BLOSUM is one type of scoring system that is used to calculate similarity between sequences. Using two or more aligned protein sequences, BLOSUM matrix assigns a score to each pair of aligned amino acids depending on whether they match and how likely it is that this match would occur by random chance. The total BLOSUM score, calculated by the sum of each score, reflects how closely the sequences are related [2]. For the construction of the p53 tree, the BLOSUM62 matrix was used.
Percent Identity is another method used to compare sequences. With this method, the sequences are compared solely based on if they have the same residues at the same position, usually expressed as a percentage [3].
Tree Construction Methods
Along with sequence similarity scoring, phylogenetic trees can be constructed using different tree drawing methods. The two methods used here are the Neighbor Joining and Average Distance methods.
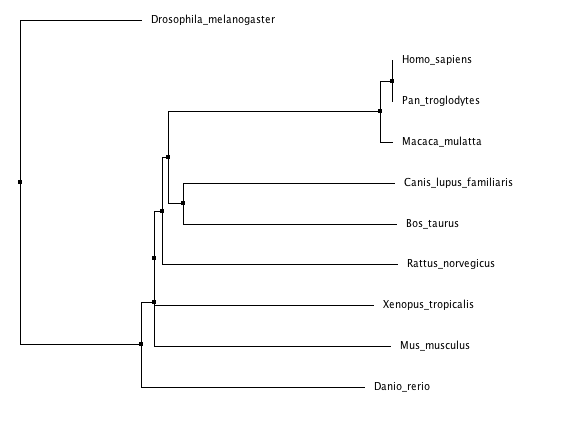
Neighbor Joining uses the similarity scores from the BLOSUM or percent identity methods to determine the relatedness of the species used in the sequence analysis. Branch lengths are then calculated based on the amount of change that has occurred since the species diverged [4].
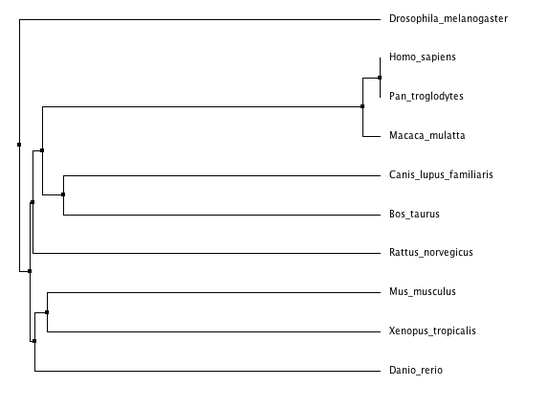
Average Distance method, like Neighbor Joining, uses the similarity scores from sequence alignment analysis to determine the relatedness of species. However, in contrast to Neighbor Joining, Average Distance joins the species with equal branch lengths and assumes that all provided species have equally diverged from the common ancestor [4].
Neighbor Joining uses the similarity scores from the BLOSUM or percent identity methods to determine the relatedness of the species used in the sequence analysis. Branch lengths are then calculated based on the amount of change that has occurred since the species diverged [4].
Average Distance method, like Neighbor Joining, uses the similarity scores from sequence alignment analysis to determine the relatedness of species. However, in contrast to Neighbor Joining, Average Distance joins the species with equal branch lengths and assumes that all provided species have equally diverged from the common ancestor [4].
Phylogenetic trees for cellular tumor antigen p53 using different methods
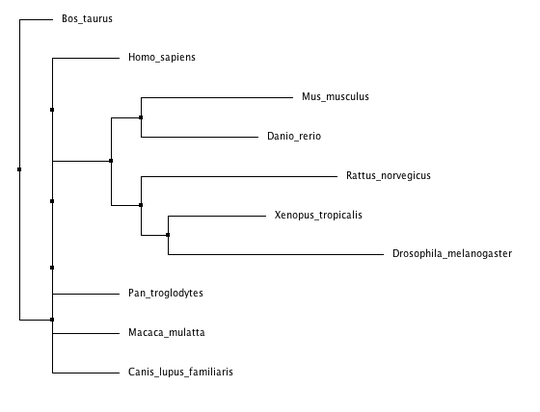
Neighbor Joining tree using BLOSUM 62
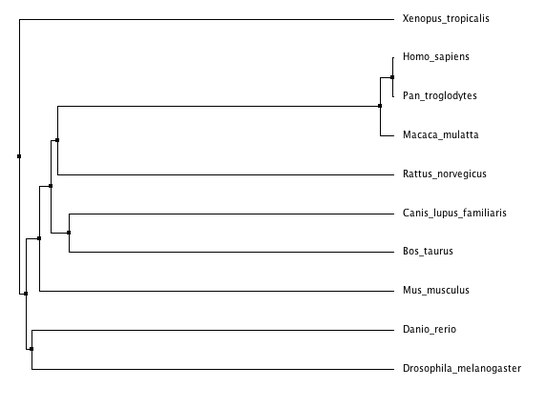
Average Distance tree using BLOSUM62
|
Neighbor Joining tree using % identity
Average Distance tree using % identity
|
Supplemental Information
| p53_homologs_aligned_sequences.txt |
References
[1] Rokas, A. (2011). Phylogenetic analysis of protein sequence data using the Randomized Axelerated Maximum Likelihood (RAXML) Program. Current protocols in molecular biology, 19-11. https://sco.h-its.org/exelixis/resource/doc/2011_Rokas_CPMB.pdf
[2] Eddy, S. R. (2004). Where did the BLOSUM62 alignment score matrix come from?. Nature biotechnology, 22(8), 1035-1036. http://profs.scienze.univr.it/~liptak/ALBioinfo/2012_2013/2011_2012/files/nbt0804-1035.pdf
[3] Fassler, J., & Cooper, P. (2011). BLAST Glossary. Retrieved January 31, 2017.http://www.ncbi.nlm.nih.gov/books/NBK62051/
[4] Cold Spring Harbor Laboratory Press. (2010). Phylogenetic Reconstruction. Evolution. Retrieved January 31, 2017, from http://evolution-textbook.org/content/free/contents/ch27.html#ch27-4-2
